
Knowing how to get where you are going may be even more critical than knowing where you are supposed to be.
That’s why leaving the house without directions doesn’t do one much good. Having a destination without a map only gets people so far.
The same is true for sales enablement.
Productivity and quota attainment top the hierarchy of key performance indicators (KPIs) as the most important business metrics for sales teams – the destination. However, knowing what needs to be done along the way to influence those metrics as an enablement professional is critical – the directions.
Enablement is key in mapping the journey to productivity, and the first step is leveraging data to identify milestones and benchmarks on the road to optimal productivity.
Mind the Early Warning Signs
First on the road to optimal productivity are leading indicators or “economic indicator[s]…that more often than not show a change in direction before a corresponding change in the state of the economy.”
Translated into enablement terms, a leading indicator is an early warning signaling if a KPI will, or will not, be achieved. Considering new rep onboarding as an example that could be measured, leading indicators answer the following questions:
- Did they complete the new hire program on time?
- Did they pass the assessments the first, second, or fifth time?
- Did they attend and actively participate in boot camp?
- Are they leveraging the appropriate content in their sales process?
Over time, these leading indicators can provide insight into how a rep will perform compared to historical new hires.
By including leading indicators in the overall assessment, an onboarding manager is able to extrapolate to other KPIs and alert leaders that there could be an impact on expected results. If a new hire is not completing their onboarding, they can surmount it will impact other metrics such as time to close two new deals or time to create pipeline. Onboarding managers can then use these early warning signs to identify reps they need to work with early in their tenure to course correct and improve their overall results.
Lagging Indicators are Your Rearview Mirror
On the flipside, lagging indicators can identify gaps in enablement content and effectiveness – but only after the fact.
Lagging indicators are “an economic indicator that more often than not maintains an existent trend for some time after the state of the economy has turned onto an opposite trend.” While they confirm or deny long-term trends, they do not predict them.
In enablement terms, these are KPIs that measure progress after the fact and have an impact on overall productivity. Examples include the amount of pipeline created, the number of opportunities a rep works at one time, win rates, average selling price, time to close the first and second deals, and the length of the sales process.
Mapping out lagging indicators as key milestones on the road to productivity can help practitioners deliver enablement programs to best support that journey. Enablement professionals can use data to identify optimal activity benchmarks or obstacles preventing a team from achieving higher win rates. After uncovering trends, practitioners can partner with leaders across the company to identify solutions to mitigate issues and fill gaps.
A simple example is using data to identify a negative trend – such as reps in one region continuously losing to the same competitor. Practitioners can use this data to partner with competitive intelligence experts to strengthen programs focused on winning against that competitor. Similarly, practitioners can also use lagging indicators in order to more effectively partner with sales leaders to better coach reps in adopting the behaviors and skills that they need to be even more successful.
Track, Analyze, and Review to Improve
The most important aspect of using data to drive performance is to stay on top of it. Data eliminates the guesswork and provides a roadmap to what success looks like for a team. Using automated dashboards to compare real-time data with historical trends can provide early warning signs that can be used to course-correct programs along the way.
Taking the leading and lagging indicators that have been mapped out to measure the new onboarding program is a great place to start for all enablement reporting. In the below example, let’s consider two fictional reps that started in the same role on the same day.
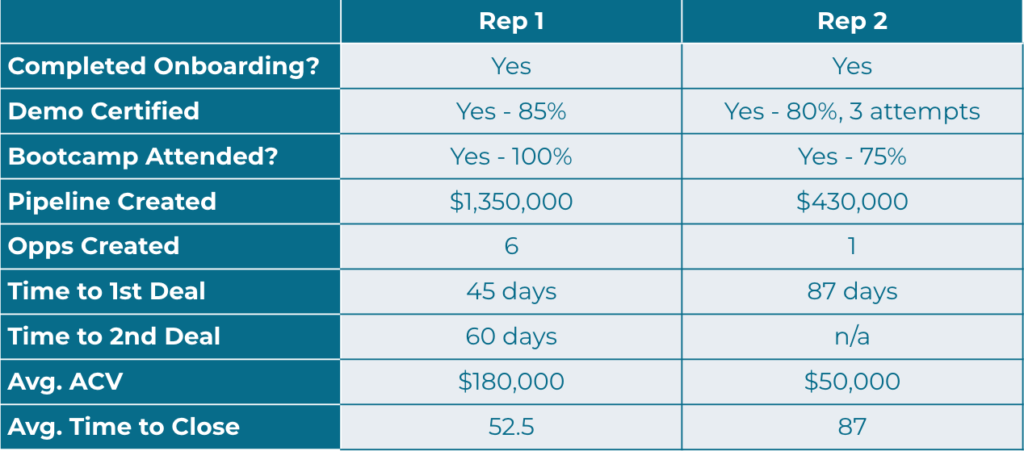
From the data, it seems evident that the second rep needs help with demos and pipeline generation. However, that may mean something is amiss in onboarding. Rather than pointing fingers at the rep and assuming that they are a low performer, enablement needs to reflect on what they’ve given the rep to be successful before coming to conclusions.
A necessary addition to the quantitative data that can be gleaned from tools like a CRM is qualitative data from surveys and conversations. In this scenario, enablement can meet with this second rep to uncover the story behind the data. On the call, enablement might uncover that there is a gap in objection handling, the product knowledge is too technical for this audience, and there are not enough roleplay opportunities.
On the flip side, by chatting with the first rep, enablement could uncover that they have nearly a decade more experience in technical sales and were previously working at one of the company’s partners. Without this information, their performance can be interpreted as a “false positive” on the effectiveness of the program due to familiarity with the space.
After marrying the quantitative data with the qualitative, a next step could be to update the onboarding program by including more hands-on training, roleplays, and leveraging internal experts like the first rep as peer mentors or subject matter experts (SMEs). This kind of reflection and holistic use of data in enablement separates well-performing teams from high-performing teams.
On the journey to productivity, the best-case scenario is knowing where one is going before they even leave the driveway. The next best scenario is having the right data along the way to course-correct in real-time.